Electric vehicles are moving from early adoption into everyday mobility. The International Energy Agency’s Global EV Outlook 2024 reported nearly 14 million electric car sales worldwide in 2023. It also recorded more than four million publicly accessible charging points by year-end. That growth changes the value of charging locations. A charger is no longer only a power device. It can become a visible roadside media asset.
So, why are ev chargers being combined with advertising displays? The answer begins with dwell time. Drivers may remain beside a charger for 20 to 40 minutes, depending on battery size, vehicle demand, and charging speed. A bright screen can present useful local information, retail offers, or brand messages during that pause. This creates a clearer connection between physical presence and digital advertising than a passing roadside sign.
The opportunity is measurable, but not automatic. The Out-of-Home Advertising Association of America reported continued growth in digital out-of-home advertising, supported by flexible scheduling and location-based delivery. Meanwhile, BloombergNEF’s Electric Vehicle Outlook 2024 highlighted the rapid expansion of charging infrastructure and the need for better utilization. That gap matters. Underused chargers waste space, electricity, and commercial potential.
Good design still matters. A screen should not distract drivers, block accessibility, or hide charging instructions. Content must remain readable in sunlight and quiet at night. Operators also need reliable uptime data and transparent advertising metrics.
The model is promising. It is not perfect. Advertising revenue may vary by location, season, and audience quality. Careful testing remains necessary.
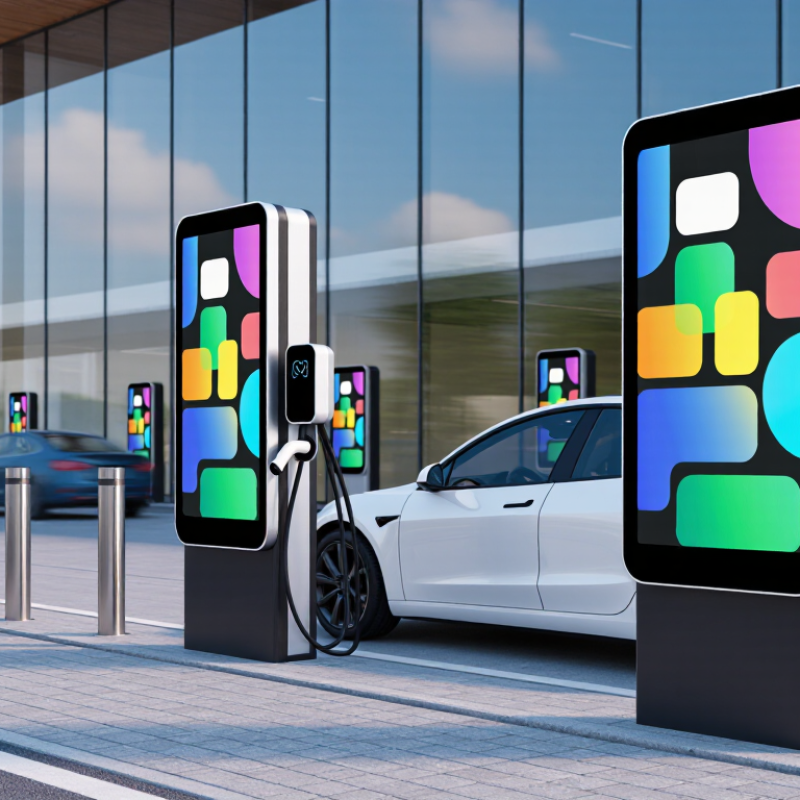
Defining EV chargers with advertising displays as a dual-service platform changes the value proposition. The site no longer serves only parked vehicles. It also becomes a measured communication point during charging sessions.
The International Energy Agency reported over 17 million electric cars were sold globally in 2024. More vehicles create stronger demand for visible, reliable charging locations.
The display can show charging status, local information, safety guidance, or paid campaigns. Keep it useful.
The Out of Home Advertising Association reported that U.S. out-of-home advertising revenue reached about $9.1 billion in 2023. This indicates continued commercial demand for physical, location-based media.
However, an EV charger display needs different standards than a roadside screen. Content should remain readable in direct sunlight, work during rain, and avoid distracting drivers near moving traffic.
Screen brightness, accessibility, network uptime, and privacy controls require continuous testing. Small failures matter.
A practical operator can measure sessions, display uptime, energy delivered, and audience exposure separately. That separation protects reporting credibility.
The platform may also support nearby retailers through location-based messages, but the commercial content should never obscure connector instructions or emergency information. The model is promising, not flawless. Poorly timed advertising could frustrate drivers waiting for a full charge. Clear communication must come first.
Why Combine EV Chargers With Advertising Displays?
Global electric vehicle sales exceeded 17 million in 2024, according to the International Energy Agency. This figure signals more than growing demand for vehicles. It also shows how charging locations are becoming valuable public touchpoints. Drivers may spend twenty to forty minutes beside a charger. That waiting period creates space for useful, location-based advertising.
A charging site can display nearby restaurant offers, retail information, or public service messages. The content should match the driver’s situation, not interrupt it. Clear pricing, charging progress, and safety instructions must remain more visible than advertisements. The screen matters. Poor contrast, small text, or excessive motion can frustrate users, especially at night.
From an operational perspective, advertising can help offset installation, energy, and maintenance costs. However, revenue forecasts should remain conservative. Some locations may attract heavy traffic, while others remain quiet for long periods. That changes the math. Operators need reliable usage data, regular equipment checks, and transparent advertising policies. Personal data should not be collected unnecessarily, and content should respect local regulations and community standards.
The model is promising, but not automatically effective. A damaged display weakens trust. Irrelevant advertisements waste attention. In my view, the strongest installations treat the screen as part of the charging experience, not as an added billboard. Useful information earns attention more consistently than noise.
EV charging turns waiting time into measurable on-site dwell time. That changes the value of digital advertising displays.
The IEA’s Global EV Outlook 2024 reported over 14 million electric car sales worldwide in 2023. It also recorded more than four million public charging points. More vehicles create more repeated charging visits. A display can measure arrival time, connection time, screen exposure, and departure time. These figures help operators understand real attention, not assumed attention.
The U.S. Department of Energy’s Alternative Fuels Data Center notes that charging duration varies by vehicle, charger, and battery condition. A short top-up may last twenty minutes. A faster session can still leave drivers waiting nearby. That window supports local offers, safety information, and useful travel content. However, dwell time does not guarantee engagement. A driver may watch the screen briefly, then check a phone. The screen may also feel intrusive.
Tips: Track median dwell time, not only average time. Separate charging time from screen-viewing time. Test brightness, message length, and placement. Keep content readable from a parked vehicle. Review results by location and time of day. Industry reports provide direction, but site-level data reveals the uncomfortable details.
An EV charging site can earn from two connected activities: charging fees and digital out-of-home advertising. Drivers pay for electricity, parking time, or both. Meanwhile, the display can show carefully selected local promotions while vehicles charge. This creates a second revenue stream from the same physical location.
The model works best when the screen reaches a predictable audience. Shopping centers, office parks, and highway rest areas offer different viewing patterns. Operators should measure sessions, display time, occupancy, and advertising impressions. Clear pricing builds trust. So does reliable equipment. A failed charger can damage customer confidence faster than a weak advertisement. Advertising revenue may also fluctuate with seasons, traffic, and local demand. That risk deserves honest forecasting. Early results are rarely perfect.
Tips: Keep charging instructions visible at all times. Separate essential service information from paid content. Use brightness controls for nighttime comfort. Track revenue per charger, not only total sales. Review campaign performance monthly. Protect customer privacy by avoiding unnecessary personal data collection. Test different screen layouts, but change one factor at a time. A practical mistake is treating every driver as the same audience. Commuters may prefer quick offers, while long-distance travelers may notice travel services. Local rules can also affect screen placement, sound, brightness, and advertising content. Consult qualified legal and electrical professionals before deployment.
Why Combine EV Chargers With Advertising Displays?
EV charging sites create a natural pause, often lasting 20 to 40 minutes. That waiting period gives advertisers measurable attention, not just passing exposure. Operators can track CPM by dividing campaign cost by verified impressions, then compare results across parking locations. Screen reach matters too. A busy urban charger may deliver broader reach, while a quieter site may generate longer viewing time. Both metrics deserve separate analysis.
Tips: Record screen uptime, average session duration, and daily vehicle visits. Compare these figures with charging demand, including peak hours and repeat users. Utilization can reveal whether displays perform best near full chargers or during slower periods. Keep measurement methods consistent. Small data gaps can distort CPM.
Charging demand adds essential context. A screen showing 8,000 impressions may look successful, but only if the estimate reflects real sessions and functioning displays. Sensor counts, charging records, and periodic manual checks can improve reliability. In practice, these sources may disagree. That is normal. Review the differences before changing pricing or content. A useful dashboard should show reach, CPM, utilization, dwell time, and energy demand together. It should also flag outages, glare, blocked views, and unusually short sessions. These details are easy to miss, yet they can change campaign performance significantly.
| Deployment Site | Reporting Month | Displays | Monthly Screen Impressions | Unique Reach | Average Frequency | Ad Fill Rate | Effective CPM | Charger Utilization | Charging Sessions | Average Session Duration |
|---|---|---|---|---|---|---|---|---|---|---|
| Urban Retail Center | April 2026 | 18 | 1,284,600 | 358,900 | 3.58 | 91.4% | $7.82 | 72.6% | 2,146 | 46 min |
| Suburban Grocery Hub | April 2026 | 12 | 746,400 | 231,800 | 3.22 | 88.7% | $8.41 | 64.8% | 1,368 | 52 min |
| Highway Service Plaza | April 2026 | 10 | 512,900 | 184,200 | 2.78 | 79.6% | $9.76 | 81.3% | 1,842 | 39 min |
| Office and Transit District | April 2026 | 16 | 1,106,700 | 326,500 | 3.39 | 93.1% | $7.36 | 58.9% | 1,724 | 61 min |
| Hotel and Entertainment Zone | April 2026 | 14 | 873,200 | 267,100 | 3.27 | 86.5% | $8.93 | 67.4% | 1,509 | 55 min |
| Community Parking Facility | April 2026 | 8 | 286,400 | 102,600 | 2.79 | 74.8% | $10.84 | 43.7% | 624 | 73 min |
| Portfolio Average / Total | 78 | 4,810,200 | 1,471,100 | 3.27 | 87.9% | $8.48 | 66.8% | 9,213 | 51 min | |
Measurement definitions: Effective CPM equals advertising revenue divided by measurable impressions, multiplied by 1,000. Screen reach represents estimated unique viewers during the reporting period. Charger utilization represents occupied charging time divided by available connector time. Metrics are reported for a 30-day operating period and exclude displays or chargers unavailable for scheduled maintenance.
It supplies electricity and presents useful information during charging sessions. The same site can serve drivers and local advertisers. Keep it useful.
It can show charging progress, connector instructions, safety guidance, local information, and paid messages. Emergency details must remain visible. Commercial content should never cover essential instructions.
Drivers may remain parked for twenty minutes or longer. This creates measurable on-site dwell time. Waiting does not guarantee attention. Some drivers check their phones instead.
Track charging sessions, energy delivered, occupancy, display uptime, exposure time, and departure time. Separate screen viewing from total charging time. Median dwell time may reveal typical behavior better than averages.
Operators may combine charging fees with advertising income. Revenue can come from electricity, parking time, or both. Advertising results may change with seasons, traffic, and local demand. Early results vary.
Shopping centers, office parks, and rest areas offer different audience patterns. A commuter may notice a quick local offer. A long-distance traveler may prefer travel information.
Screens should remain readable in direct sunlight and during rain. Operators should test brightness, accessibility, network uptime, and nighttime comfort. Small failures matter.
Collect only necessary information and apply clear privacy controls. Report charging activity, display uptime, and audience exposure separately. Avoid claiming every impression equals genuine engagement. That assumption needs review.
Combining EV chargers with advertising displays creates a dual-service platform that supports both electric mobility and digital communication. As global EV sales exceeded 17 million in 2024, charging infrastructure is becoming a valuable point of contact between businesses, drivers, and local communities. While vehicles charge, users remain on-site for a measurable period, creating useful dwell time for relevant, location-based messages and promotions.
This model answers the question, “why are ev chargers being combined with advertising displays,” by connecting charging demand with an additional revenue stream. Operators can generate income from charging fees while selling digital out-of-home advertising space. Performance can be evaluated through key metrics such as cost per thousand impressions (CPM), screen reach, charger utilization, session duration, and overall charging demand. Together, these measurements help determine audience value, improve placement strategies, and support more efficient investment in charging infrastructure.

Orange Energy